Mastering Modern Gradient Infographic Timelines and Business Infographic Elements
Introduction to Infographic Design
Infographics are a powerful tool for visual communication, combining data, design, and storytelling to convey complex information in an engaging and accessible way. Whether you're a business professional, educator, or creative, understanding how to use and create infographics can significantly enhance your ability to communicate effectively.
The Purpose of Infographics
Infographics serve multiple purposes, including:
- Data Visualization: Simplifying complex data into easily digestible visuals.
- Storytelling: Telling a compelling narrative through a combination of images and text.
- Educational Tool: Helping to explain concepts, processes, and trends in a clear and engaging manner.
Why Use Gradient Infographic Timelines?
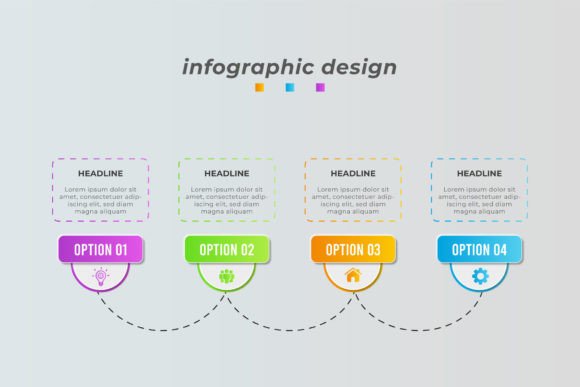
Gradient infographic timelines are particularly effective for showing the progression of events, milestones, or achievements over time. The use of gradients adds a visually appealing and modern touch, making the timeline more engaging and easier to follow. This is especially useful in business presentations, project management, and educational settings where a clear, chronological representation is essential.
Key Components of a Gradient Infographic Timeline
- Title: A clear and concise title that summarizes the timeline's purpose.
- Timeline Axis: A line or path that represents the passage of time, often with gradient colors to indicate different phases or periods.
- Milestones: Key events or points along the timeline, typically marked with icons, images, or brief descriptions.
- Descriptions: Detailed explanations or additional information about each milestone.
Creating a Gradient Infographic Timeline
To create a gradient infographic timeline, you need a basic understanding of graphic design tools like Adobe Illustrator. Here’s a step-by-step guide:
- Open Illustrator: Start by opening Adobe Illustrator and creating a new document.
- Set Up the Document: Define the size and orientation of your document based on your needs (e.g., landscape for a horizontal timeline).
- Create the Timeline Axis: Draw a line or path to represent the timeline. Apply a gradient fill to this line to add a modern, visually appealing effect.
- Add Milestones: Place markers at key points along the timeline. You can use icons, symbols, or small images to represent these milestones.
- Insert Descriptions: Add text boxes near each milestone to provide detailed information. Use a clean, readable font and ensure the text is well-aligned with the timeline.
- Final Touches: Review and refine your design. Adjust the gradient, spacing, and overall layout to ensure clarity and aesthetic appeal.
What Are Business Infographic Elements?
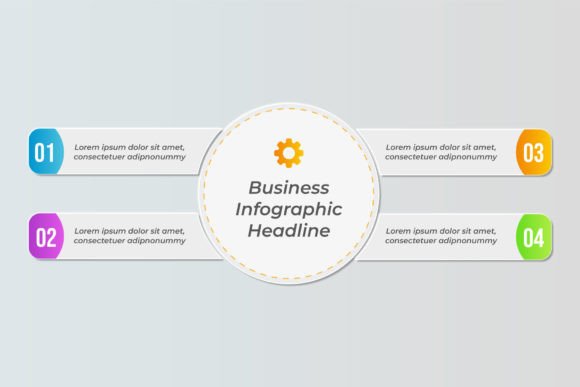
Business infographic elements are pre-designed, customizable components that can be used to build infographics specifically tailored for business purposes. These elements often include charts, graphs, icons, and other visual aids that help in presenting business-related data and information.
Included Files: Illustrator EPS
When you download a set of business infographic elements, they usually come in various file formats, including Illustrator EPS. EPS files are vector-based, meaning they can be scaled up or down without losing quality. This makes them ideal for both print and digital use.
Editing Business Infographic Elements
Editing these elements is straightforward if you have a basic understanding of Illustrator. Here’s how you can do it:
- Open the EPS File: Open the EPS file in Adobe Illustrator.
- Select the Element: Choose the element you want to edit, such as a chart or icon.
- Edit the Text: Click on the text box and type in your own content. You can also change the font, size, and color to match your brand or style.
- Customize Colors and Styles: Modify the colors and styles of the elements to align with your branding. This can be done using the color palette and style options in Illustrator.
- Save and Export: Once you’re satisfied with your edits, save the file and export it in the desired format (e.g., PNG, PDF, or JPEG) for use in presentations, reports, or online platforms.
Business Presentations
Gradient infographic timelines and business infographic elements are invaluable in business presentations. For example, a sales team might use a gradient timeline to show the progress of a major project, highlighting key milestones and achievements. This not only makes the presentation more engaging but also helps the audience understand the project's trajectory and success.
Educational Materials
In education, teachers and students can use these tools to create visually rich and informative materials. For instance, a history teacher might use a gradient timeline to illustrate significant events in a particular era, making the subject more relatable and memorable for students.
Project Management
Project managers can benefit from using gradient timelines to track and communicate project progress. By clearly marking key deliverables and deadlines, these timelines help keep everyone on the same page and ensure that the project stays on track.
Common Misunderstandings
- Assuming Complex Tools Are Required: Many people think that creating high-quality infographics requires advanced design skills. However, with user-friendly tools like Adobe Illustrator and pre-designed elements, even beginners can create professional-looking infographics.
- Overloading with Information: It’s easy to get carried away and include too much information in an infographic. Keep it simple and focused to ensure clarity and impact.
Tips for Effective Infographic Design
- Keep It Simple: Use a clean, uncluttered design to make your infographic easy to read and understand.
- Use Consistent Branding: Ensure that the colors, fonts, and styles align with your brand guidelines to maintain a professional and cohesive look.
- Focus on Key Messages: Highlight the most important information and use visuals to support and enhance the message.
- Test and Iterate: Get feedback from others and be open to making adjustments to improve the clarity and effectiveness of your infographic.
Conclusion
Gradient infographic timelines and business infographic elements are powerful tools for visual communication. By leveraging these tools, you can create engaging, informative, and visually appealing content that resonates with your audience. With a basic understanding of tools like Adobe Illustrator and the steps outlined in this article, you can start creating high-impact infographics that enhance your presentations, reports, and educational materials.
Whether you’re a business professional, educator, or creative, mastering the art of infographic design can significantly boost your ability to communicate effectively and make a lasting impression. Start exploring the world of infographics and see how they can transform the way you present and share information.